International school spending – how does the UK compare?
Monday 23 October 2017
Over the last six months, school funding has been an almost constant feature in policy debate, from the proposed introduction of a National Funding Formula to the longer running cuts and freezes schools are facing to their budgets. However, far less has been said on how the UK compares internationally. While there are obviously some ‘health warnings’ around comparing international data, including recognising that different countries may be pursuing different priorities, international comparisons can still give us insight into how outcomes vary (or don’t vary) with expenditure.
When looking at The Organisation for Economic Co-operation and Development (OECD) data, two key points stand out. Firstly, UK school spending is high in comparison to most other OECD countries and secondly, total spending in the UK is increasing at a faster rate. With a total expenditure of over $110,000 per student over the course of their schooling, the UK has the sixth highest expenditure of any OECD country. In contrast, New Zealand spends just over $80,000 per student, while the often citied high achieving country of Japan also spends under $100,000 per student.
UK education spending is among the highest in the OECD.
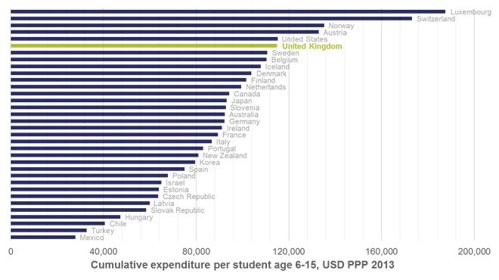
Source: OECD, PISA 2015, Table II.6.58
Spending in the UK has risen by more than 25 per cent over 2008−2014, more than twice the OECD average of 10 per cent. Several countries have actually seen their per pupil spending fall over this period, including France and the United States. While the 2015 freezes on per pupil school funding will affect the UK’s strong performance on this measure, the long-term picture is one of significant increases in spending.
UK education spending has increased faster than most other OECD countries.
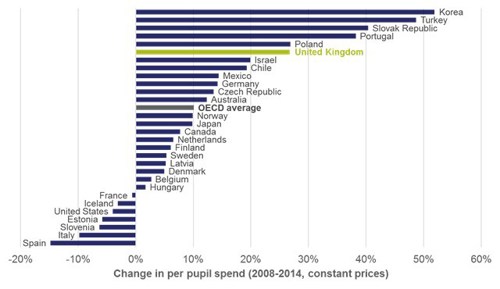
Source: OECD, Education at a Glance 2017, Table B1.3
Despite the UK’s relative high level of funding, there is evidence that UK schools face resource challenges and face some key challenges more keenly than countries with lower expenditure levels. 44 per cent of UK students are taught in schools in which the headteacher reports that inadequate infrastructure, such as poor quality buildings and grounds, hinders performance at least to ‘some extent’. This is far above the OECD average of 35 per cent. Most UK headteachers also report difficulty in filling teacher vacancies. For example, the Trends in International Maths and Science Study (TIMSS), shows that 61 per cent of Year 9 maths pupils in England are taught in schools that have difficulty in filling maths vacancies, with a quarter taught in schools that find it ‘very difficult’ to fill these vacancies. This compares to an international average of just 15 per cent and 5 per cent respectively, with some countries, including Singapore and Hong Kong, having no pupils taught maths in schools that are finding it very difficult to recruit maths teachers.
International data also highlights that for high-income countries, there is no clear relationship between school funding and PISA scores. As shown in the chart below, for countries spending less than $50,000 per pupil, outcomes seem to improve on average as expenditure increases. For countries spending more than $50,000, this relationship breaks down. For example, Luxembourg has the highest average spend per pupil, of $187,000, yet it is Singapore that records the best science performance, despite spending nearly $60,000 less per pupil. Similarly, Poland and Denmark have very similar test scores but expenditure in Denmark is 50 per cent higher than in Poland.
This is not to say that extra funding (or indeed cuts in funding) will make no difference to schools. These findings simply show broad patterns of spending and outcomes at a national level. There are studies using more sophisticated statistical methods, such as the work by LSE academics, that do suggest a positive impact from additional funding for individual schools. Nevertheless, these results demonstrate that at a national level, funding in and of itself is not the only concern; how funds are spent also matters, at both the system and individual school level.
Once expenditure is above $50,000, there is no relationship between expenditure and outcomes – we need to look at how money is spent.
Source: OECD, PISA 2015, Figure II.6.2
The link between funding and outcomes was explored further in a recent event NFER hosted with the Centre for Education Economics. Take a look at the video below to hear Ben Durbin, Head of International Education at NFER, speak in more detail on the themes covered in this blog.
You can find his full slides here. Evidence on the link between funding and outcomes is also explored in this NFER literature review.