Interpreting assessment outcomes
Formally assessing pupils’ progress can be hard work. You need to source – or write – a suitable assessment. You need to set aside classroom time, sort out equipment, and make sure everyone can access the content. Even once you’ve marked the tests and totalled the scores, there is still one crucial final stage: interpreting the outcomes of the assessment.
One of the core elements of assessment theory is validity. Validity is a property not of individual tests, but is determined by how the results are interpreted. For example, a spelling test may be a sound assessment of spelling skills but if the outcomes are used to determine writing competence we’d say it wasn’t a valid use because of construct underrepresentation – writing is much more than just spelling accuracy. Read our guide on how to ensure a test is valid.
Raw scores
Totalling the marks from all the questions in a test gives you a pupil’s 'raw score'. Of course, this score has no meaning independently of the maximum possible score for the test, so a natural first step is to convert it into a percentage.
However, this percentage score is still quite uninformative in the absence of knowledge about the difficulty of the test. Even on tests that seem closely comparable (e.g. arithmetic and reasoning mathematics tests), you cannot simply compare percentages to ascertain progress, because creating two tests of exactly identical difficulty is very hard. For example, if a pupil scored 50% on an arithmetic test and 60% on a reasoning one, it may seem apparent that they performed better in reasoning. However, it is possible that the arithmetic test is actually harder, and the pupil is working at a similar level for both. Raw scores on their own, do not give information about the difficulty of the test.
Lurking beneath this problem is another one: raw scores on their own (even as percentages) can tell you very little about a child’s capabilities. Marks in tests are not like centimetres on a ruler: a child who scores 70% on a reading test is not somehow “twice as good at reading” as one who scored 35%. To illustrate this point, consider the graph below:
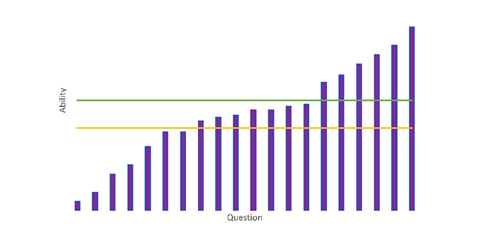
The purple bars represent questions in an imaginary test, and their relative heights show the increasing level of difficulty of each question. Each of the horizontal lines represents a pupil. Pupil A (orange) can answer 7 questions (35%), whereas Pupil B (green) can answer 14 (70%). Looking at raw scores alone, it seems clear that B is much stronger than A, but in fact the difference is relatively small – the size of the gap is largely an illusion created by a cluster of questions that are just easy enough for B but just too hard for A.
Likewise, simply looking at the difference between an individual pupil’s raw scores on two tests taken at different times can be misleading: a child who gets 20 marks on one test and then 30 marks on the next should not be considered to have made “ten marks of progress” because the two tests are highly unlikely to be of the same exact level of difficulty.
Standardised scores
As we have seen, the fundamental problem with raw scores is that they do not point to some fixed reality outside the test itself. One way to overcome this is to use an assessment where raw scores can be converted into standardised scores. Many professionally produced tests, including NFER Tests for years 1-6, give additional outcomes, beyond simple proportions or percentages. One of these measures is standardised scores.
Standardised scores allow a pupil’s performance to be compared against that of a nationally representative sample, with 100 typically representing average performance. Some assessments that have been trialled with a particularly large sample can also yield age-standardised scores, which take account of differences in pupils’ ages.
Standardised scores yield far richer and more trustworthy information than raw scores can. For instance:
- they can show how a pupil’s performance relates to the national average, as measured against a representative sample
- they can allow meaningful comparisons between performance on different subjects, because they take into account the difficulty of each test
- they can allow meaningful comparisons between pupils
- they can allow you to monitor a pupil’s progress over time.
Handle with care
For all of their advantages, even standardised scores need to be interpreted thoughtfully. This is because no test can cover the entire curriculum area it assesses, so a pupil’s ‘true score’ may not be the same as their standardised score from that particular test.
Rigorous tests acknowledge this by publishing confidence intervals. These tell us the range in which a pupil’s ‘true score’ is (say, 90% of the time) likely to fall. To give one real-life example, on one year 4 reading test, a standardised score of 108 has a 90 percent confidence interval of -8/+7, meaning a nine-in-ten chance that the ‘true’ score is between 100 (i.e. 108-8) and 115 (i.e. 108+7). The difference between 100 and 115 is wide: 100 is the average score, whereas a score of 115 would put a pupil in the top twenty percent of pupils taking that test. And remember that 10 percent of pupils (on average, three in a class of 30) will have a true score outside their 90 percent confidence intervals.
This fact is not an argument against well-constructed, thoroughly trialled assessments. They provide valuable information, and any possible alternative is likely to have the same issues (or worse). However, it is an argument against giving all your attention to a single number, especially when communicating with parents and children. As part of a balanced diet of ongoing assessment, formal assessment results should supplement, not supplant, a teacher’s overall judgment about a child’s capabilities.
Just as importantly, tests provide far more than just a standardised score. Responses to individual questions can yield valuable information about pupils’ (or classes’) learning gaps and misconceptions. Many schools use assessment platforms that store data on a question-by-question level, allowing trends to emerge for a particular question or topic area. Looking at pupils’ performances on individual, or interrelated sub-sets of questions, can provide a far richer insight into how best to support them in progressing further. Just as the pupils themselves have to answer a range of questions in any test, effective formative assessment relies upon considering the component parts of a pupils’ learning rather than just the ‘final score’ that these generate.
Gain rich insights from your test data with the NFER Tests Analysis Tool.