Report Spotlight: Programme of Study
NFER Tests are accompanied by the NFER Tests Analysis Tool with access free to all test purchasers. The Analysis Tool can help convert raw test scores into standardised and age-standardised scores but it is particularly helpful for drilling down into the test data to learn more about the performance of individual pupils, groups and classes of pupils, as well as the performance of whole school years or key stages.
To help with data interpretation, the Analysis Tool uses a variety of reports which group and present the data in different ways. One such report is the Programme of Study report.
What does the Programme of Study report focus on?
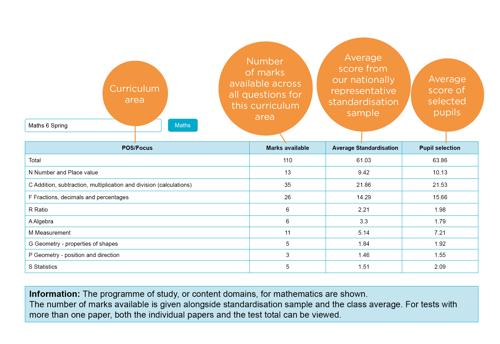
The Programme of Study report is designed to analyse the performance of the children on the different strands of the curriculum within each subject. The example report below shows information related to the Year 6 Spring mathematics test. From the left, the first column breaks down the mathematics curriculum into the main content strands of ‘Number and place value’, ‘Addition, subtraction, multiplication and division’, and so on.
The second column shows the total number of marks that are available in the Year 6 Spring mathematics test, as well as the number of marks available in each of the curriculum strands. Although this example report shows the contents of the entire Year 6 Spring Mathematics test, a teacher could choose to look at only one of the three papers that make up the test. That way, they could focus on arithmetic skills for example, and the list of curriculum areas would be restricted to those which appear in the arithmetic test. Likewise, if a different year group were under scrutiny, the list of curriculum strands would change to reflect that algebra and ratio are not components of the curriculum in younger years.
Example Programme of Study report
Why does the Programme of Study report show the performance of pupils nationally?
The third column, titled ‘Average standardisation’, gives the average number of marks that were achieved by the sample of pupils that trialled the test as it was developed and whose test results determined the standardised scores.
If we look at the average marks that were achieved by the standardisation sample we can see that some topics appear to be harder than others. For example, in ‘Number and place value’ the pupils were achieving 72 per cent of the available marks while for ‘Statistics’, only 30 per cent of the available marks were scored. It is unsurprising that the pupils were confident with the ‘Number and place value’ content as it is the backbone of much mathematical understanding and it is central to the mathematics curriculum from Year 1. However, the comparison with the performance in ‘Statistics’ reminds us that we must be conscious that, for some content areas, there are relatively few questions assessing that curriculum strand. This means that even familiar areas of the curriculum, such as ‘Statistics’, may appear to be more difficult if one or two of the questions in that particular test are more difficult. It’s therefore helpful to have a sense of how well pupils nationally were completing questions in each curriculum strand before looking at how pupils in individual schools have performed.
It is important to note that the large sample of pupils who trialled the tests was representative of the national population. It had the same proportions of pupils in each Government Office Region as is seen nationally and the distribution of schools the pupils came from matched the national distribution in terms of achievement.
How would I use the Programme of Study report with my pupils?
The final column, which is titled ‘Pupil selection’, gives the average number of marks that the pupils achieved in this particular class at school. We can see from the average total score (63.86) that the pupils are encouragingly performing slightly above the national standard (61.03), but let’s take a closer look across the curriculum strands.
The two areas these pupils seem to find most difficult are ‘Ratio’ and ‘Algebra’. These are both strands that are new to the curriculum in Year 6 and it might be expected that in the spring term, pupils are still improving their understanding of the content. However, if we also compare to the performance of the national sample then further detail is revealed. Both the national sample and these pupils found the ‘Ratio’ questions difficult, with pupils scoring about a third of the available marks in each case. However, for algebra, the national sample has scored more highly, achieving a little over 50 per cent of the marks as compared with 30 percent of the marks for the pupils in this class. It might, therefore, be wise for the class teacher to review the questions in the test which are ascribed to the ‘Algebra’ strand. This can easily be done through the Question Level Analysis report which gives the average score of the pupils (both nationally and in our class) on each question, together with the specific curriculum strand being assessed. Analysing why these pupils were not answering these questions correctly can provide information on misconceptions or gaps in knowledge that need to be addressed, either with the whole class or with a subsection.
As well as identifying areas of weakness, it is also good to note strengths. For example, our pupils have outperformed the standardisation sample in ‘Measurement’, achieving two-thirds of the available marks as opposed to just under half. Sharing good practice in the teaching of this curriculum strand could raise attainment elsewhere in the school or across schools.
What other functions does the Programme of Study report have?
The NFER Test Analysis Tool has a filter function which enables teachers to look at the performance of specific groups of pupils within a class or year. Reports can be generated using this function which highlight the differences in performance between genders, pupils born in different terms (age), pupils eligible for free school meals, pupils of different ethnicities, and pupils with different educational needs.
For each of these filters the resulting report displays six columns instead of four. The additional two columns give the average scores of the selected filter category e.g. ‘male’, and the average scores of the remaining pupils, which in our example would be the female pupils. However, where there are more than two categories within the filter, the final column displays all the pupils which are not in the one selected category. For pupils with special educational needs, if we choose to display the data for pupils categorised as ‘E’ (for Education, Health and Care Plan) then the final column would display the data for pupils categorised as ‘K’ and ‘N’ (SEN support and no special educational need).
A further function of the analysis tool is that teachers can create their own groups of pupils, perhaps to show an ability set or to indicate pupils receiving some intervention. Similarly to the filters, the Programme of Study report can display the performance of pupils in a teacher-created group compared with pupils excluded from the group. Looking at the performance of smaller groups of pupils can help to target teaching where it is needed most, whether it is helping to identify a core concept that lower achieving pupils have failed to master or an area in which higher attaining pupils need more practice.
Summary
The Programme of Study report is a fast and user-friendly way to extract helpful information from your pupils’ assessment data, ensuring that the data can be used diagnostically to inform future teaching. Having a greater understanding of the pupils’ strengths and weaknesses can direct teaching more efficiently and improve pupils’ performance, giving benefits to all.