Pupil numbers and school finances: What do we know about how demographic change is impacting on schools?
Thursday 23 October 2025
 England’s schools are continuing to face substantial financial pressures, with almost three quarters of primary school leaders anticipating an in-year budget deficit in 2025/26. With declines in pupil numbers set to continue to impact schools in the coming years, this is only likely to exacerbate these pressures on schools.
This blog draws together and updates NFER evidence on the impact of falling pupil numbers and schools’ financial positions to consider the potential impact of demographic change on school finances going forward.
School finances and demographic change are closely intertwined
The Department for Education (DfE) forecasts primary pupil numbers will fall by five per cent (equivalent to approximately 185,000 pupils) between January 2025 and 2028, with a further drop of approximately 115,000 pupils expected from January 2028 and 2030 (equating to an overall projected drop in pupil numbers of seven per cent), as shown by Figure 1.
This is an equivalent number of pupils to over 1,000 average sized primary schools. While secondary pupil numbers are set to peak in 2026, DfE is also forecasting a decline of 97,000 secondary pupils by 2030. The declining pupil population is largely driven by a declining birth rate, alongside expected changes to population migration.
Figure 1 - State primary pupil number projections for England
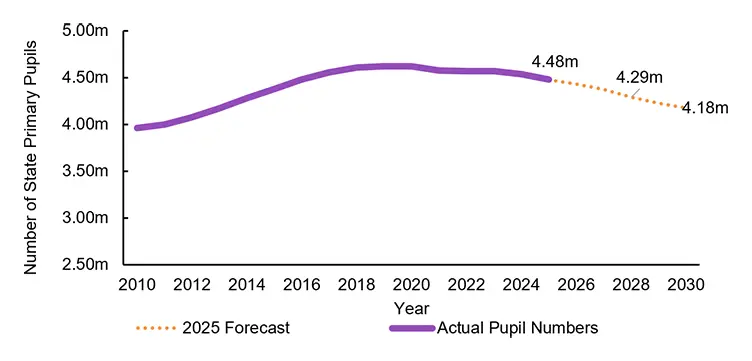
Source: National pupil projections by the Department for Education (DfE) for the reporting year 2025
Declining pupil numbers are now impacting schools across all regions of England
Forecast declines in primary pupil numbers follow an overall decline in primary pupil numbers across all regions since 2017/18, as shown by Figure 2.
While our previous blog series and recent analysis by the Education Policy Institute have highlighted the particularly large drop in pupil numbers in London to 2023/24, Figure 2 shows that while London remains the region with the largest decline in pupil numbers, schools in other regions are also being increasingly impacted by declining pupil numbers.
Outside of London, Yorkshire and the Humber and the South East have experienced relatively large drops since 2017/18 at 3.9 per cent and 3.0 per cent respectively. The local authorities (LA) outside of London that saw the largest drops include Brighton and Hove (at 10.3 per cent) and the Isle of Wight (at 7.8 per cent) in the South East and Calderdale (at 9.1 per cent) in Yorkshire and the Humber.
Even the West Midlands and the East of England regions, where pupil numbers had increased slightly between 2017/18 and 2023/24, are now in decline, relative to 2017/18 levels.
Figure 2 - Comparison of change in primary pupil numbers between 2017/18 to 2023/24 and between 2017/18 and 2024/25
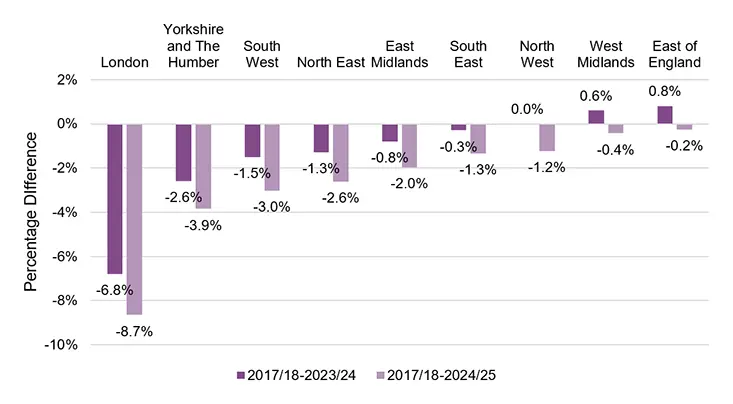
Source: NFER analysis of DfE’s School, Pupils and their characteristics publication
In line with our previous blog series, Figure 3 shows that schools are having to reduce the number of classes (by 4.8 per cent nationally) and average class size (by 2.5 per cent nationally) in response to declining pupil numbers (by 2.4 per cent nationally), with class numbers reducing more rapidly than class sizes.
This is in line with findings from our recent Teacher Voice survey which highlighted that, among rural primary schools concerned about demographic change, two in five schools reported increasing the use of mixed-age classes in recent years.
Figure 3 Percentage difference in pupil numbers, average class size and total class number between 2017/18 and 2024/25
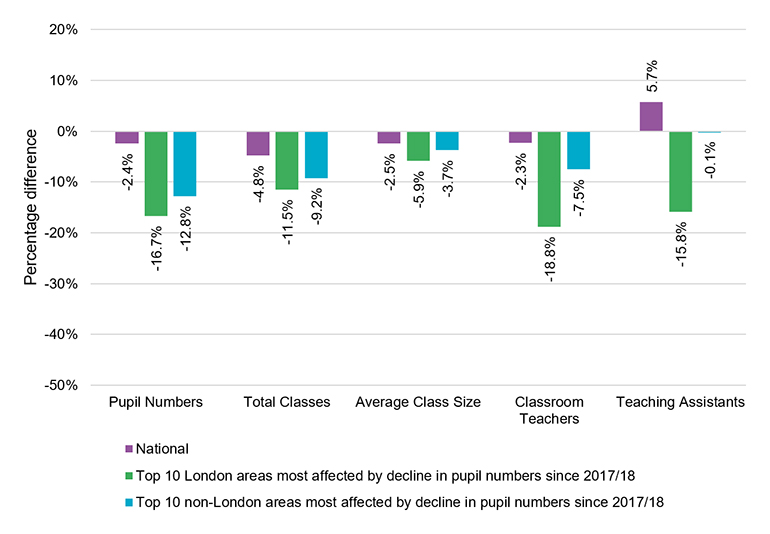
Source: NFER analysis
Figure 3 also shows that declining pupil numbers have also led to staffing reductions in affected areas. Between 2017/18 and 2024/25, classroom teacher full-time equivalents (FTE) have declined by:
- 18.8 per cent in the top 10 London LAs most affected by declining pupil numbers (with a 16.7 per cent decline in pupil numbers over this period)
- 7.5 per cent in 10 non-London LAs most affected by declining pupil numbers (with a 12.8 per cent decline in pupil numbers); and
- a more moderate 2.3 per cent nationally.
While classroom teacher FTE have declined more rapidly than class numbers in the London areas most affected by declining pupil numbers, this suggests that schools are adapting their staffing models and provision in response to declining pupil numbers (e.g., employing fewer specialist teachers).
Similarly, since 2017/18, teaching assistant (TA) FTE has:
- declined by 15.8 per cent in the top 10 London areas most affected by declining pupil numbers; and
- remained largely stable (at -0.1 per cent) in the top non-London areas.
This is against a national trend of increasing TA numbers (at 5.7 per cent). Given the key role that TAs play in supporting pupils with SEND, this raises important questions about the impact that declining roles may have been having on the quality provision for these pupils going forward.
This is in line with survey evidence gathered by the DfE earlier this year which found that among primary school leaders who reported taking actions in response to a decline in falling pupil rolls, 89 per cent reported that TAs were now providing support for a greater number of pupils with SEND.
School finances under pressure
| Deficit (Surplus): A school with negative (positive) overall revenue balance. |
In the remainder of this blog, we consider the current state of school finances to better understand the implications of demographic decline for schools. As school funding is tied to pupil numbers, a reduction in pupils is likely to exacerbate schools’ current financial pressures.
For example, in 2025/26, schools are receiving at least £4,955 for every primary pupil. As such, while a drop in pupils may not be enough to reduce class numbers and therefore save on staffing costs, schools would still lose a large amount of funding.
This is reflected in the high level of school senior leaders who said they were concerned about the impact of demographic decline in their setting. Indeed, three in every five primary school leaders reported they are somewhat or very concerned about the impact of declining pupil numbers on their settings.
While total secondary pupil numbers are not forecast to start dipping for a couple more years (although secondary pupil numbers in some local areas have begun to decline from their peak), two in five secondary senior leaders reported being at least somewhat concerned about the impact this may have on their schools.
In the 2023/24 financial year i , more than one in eight primary schools had an overall deficit balance, and almost one in ten secondary schools* (includes academy and LA maintained schools, albeit figures for academy schools are indicative as the legal entity is the academy trust rather than individual academy schools).
Any school running an overall deficit is expected to take steps towards returning to a neutral financial position, so this highlights that a considerable share of schools will be facing demographic decline in the context of already challenging financial circumstances.
However, not all schools are equally likely to be in deficit, such that some schools are likely to be particularly prone to the impacts of declining pupil numbers:
- By location: The proportion of primary schools in London with a negative reserve balance (20 per cent) is over double that in the East of England (9.3 per cent). The rate of schools in deficit was also comparably high in the North East (15.9 per cent) and Yorkshire and the Humber (14.7 per cent), as compared to the national proportion at 13.2 per cent.
- By Ofsted headline judgements: ii(which have since been scrapped): While schools judged to be Inadequate or Requires Improvement are disproportionally in deficit, Good and Outstanding schools are less likely to be in deficit. For example, 35.1 per cent of primary schools judged to be Inadequate are in deficit, as compared to only 10 per cent of primary schools judged to be Outstanding. These patterns may be explained by the fact that schools with lower Ofsted judgments may attract fewer pupils and face greater financial challenges as a result. Another explanation may be that schools who are mismanaged may be more likely to have both poor finances and a lower Ofsted judgment.
- By school type: Primary academies (10.9 per cent in a deficit) are 3.9 percentage points less likely to be in deficit in than LA maintained schools (14.8 per cent). However, this may partly reflect the difference in financial years and structures between both groups.
- By school size: Small primary schools (up to 150 pupils) are significantly more likely to be running an overall deficit (at 16.2 per cent) than large schools (with 450 or more pupils, at 8.3 per cent).
We do not observe any consistent relationship between the level of deprivation of a school and the school’s financial position.
However, there has not been a clear pattern between school finances in 2023/24 and changes in pupil numbers
There is no consistent pattern between changes in pupil numbers and revenue balance (or changes in revenues against 2020/21) in 2023/24. This is not altogether surprising given that changes in pupil numbers are only one of a number of financial pressures impacting on schools in recent years.
In addition, school funding operates on a lagged funding basis whereby schools receive funding each year based on pupil numbers from the year before, such that the financial impacts may not yet reflect the most recent fall in rolls (although we do not observe a relationship when we use lagged pupil numbers either).
Another reason for the lack of pattern is that some schools experiencing the financial impacts of declining pupil numbers may be having to restructure, merge or close. Indeed, there has been a particularly marked reduction in the number of primary school numbers since January 2023 with reduction of 22 schools in the 2023 calendar year and a further 40 fewer schools in 2024 (as compared to January 2023).
This appears to have particularly impacted schools in the areas most affected by declining rolls. Between January and December 2024, there were:
- five primary school closures and five primary school mergers iii in the 10 London LAs that have experienced the greatest decline in pupil numbers since 2017/18 to 2024/25; and
- three closures and one merger in the 10 LAs outside of London with the largest declines in pupils.
This compares to 1.3 primary school closures and 0.9 mergers for every 10 LAs in the rest of England.
What do projected changes in pupil numbers mean for school finances?
To explore how many primaries might be in financial trouble if forecasts for falling pupil numbers are borne out, we investigate how many primary schools would have been running a negative overall revenue balance in the 2023/24 financial year for a given percentage decline in pupils (assuming no mitigating actions are taken).
This is based on the minimum funding which each additional pupil attracts. We focus our scenarios on LA maintained schools only, as revenue balances for academies are indicative.
Our scenario modelling shows that for a two percent decrease in the percentage of pupils in an LA maintained primary school, without the possibility of adjusting expenses or any other sources of revenues (e.g., holding all other things equal), the number of LA maintained primary schools running an overall deficit in 2023/24 would have increased by 4.5 percentage point from 14.8 per cent to 19.3 per cent.
Larger losses, of five and ten per cent, would have made the proportion of LA maintained primary schools in a deficit increase from 14.8 per cent to 26.8 and 40.8 per cent respectively.
While these estimates represent upper bounds for the impact of demographic change on school finances given that schools are likely to take cost cutting steps where possible, they highlight that the scale of changes in pupil numbers projected have the potential to have a significant impact on the balances of many primary schools as their finances currently stand – particularly as schools are likely to be impacted unevenly by declining rolls.
Managing demographic change is likely to remain a critical challenge for schools for many years to come
Although the impacts will not be felt evenly across all schools, primary schools in all regions of England are now starting to experience the impact of declining pupil numbers on their settings – with the scale of impacts only increasing over the next five years.
In the context of the challenging financial circumstances already faced by some primary schools in 2023/24, unless per pupil funding is increased, this demographic change will require significant cost-saving measures across schools.
As schools contend with these challenges, it is crucial that schools are adequately supported by local and national government to minimise the risk of adverse impacts on pupils.
Footnotes
[i] Based on the 2023/24 Consistent Financial Returns and Annual Academies Return. Estimates may not match other sources as our analysis is based on schools with a full financial year of data only, excluding erroneous values (e.g., where schools have no income reported in financial year). The 2023/24 financial year for LA maintained schools ran from April 2023 to March 2024 and for Academies from September 2023 to August 2024. Estimates for academy and LA-maintained schools are not directly comparable as figures for individual academies are notional (as the legal entity is the academy trust, rather than the individual school).
[ii] Ofsted judgments as of June 2024
[iii] This includes primary academies, free schools, and local authority-maintained schools where DfE have given the reason for closure as ‘Closed’ and where a closure date is recorded over this period. We focus on school closures recorded as closures and amalgamations/mergers only, as opposed to other reasons such as converting into an academy or transferring to a new sponsor.
Please note the article has had a minor amendment since the original publication to make it clearer that all changes in the number of primary schools are reported relative to January 2023