Changing the subject? How EBacc is changing school timetables
Thursday 20 July 2017
Yesterday, the Secretary of State confirmed that the Government’s ambition remains for 90 per cent of pupils to be entered for GCSEs in the EBacc subjects, although the timescale for expecting schools to achieve this goal has been put back from 2020 to 2025. This is rather a timely change as our recent analysis of teacher recruitment and retention indicated that teacher supply challenges, particularly for science and modern foreign languages teachers, would make it difficult for the Government to achieve its aim in such a short time.
We analysed the extent to which schools have adapted their timetables in response to the incentives that EBacc presents, including for younger year groups not studying towards GCSE qualifications. We looked at data from the School Workforce Census on the subjects taught at secondary schools and the number of hours spent teaching each subject. The analysis suggests that the weight given to EBacc subjects in the school curriculum has grown steadily since the introduction of the EBacc measure in 2010, for pupils of all ages in secondary schools.
Figure 1 shows that there has been an increase in curriculum time dedicated to EBacc subjects at Key Stage 4 (KS4), rising from 55 per cent in 2010 to 65 per cent in 2016. While more modest, there have also been changes to the percentage of the Key Stage 3 (KS3) curriculum dedicated to EBacc subjects, increasing from 56 per cent in 2010 to 62 per cent in 2016.
Figure 1: The proportion of curriculum time dedicated to EBacc subjects has grown since 2010
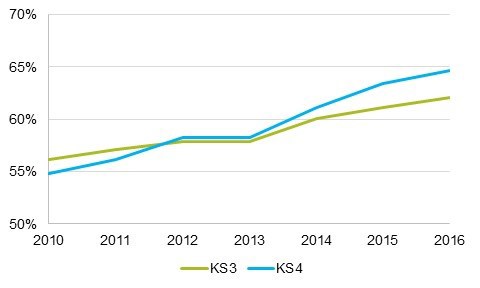
Source: School Workforce Census Statistical First Release
The accountability changes therefore seem to have had a greater impact on the KS4 curriculum. This is where the policy is most likely to have had the most impact, as some pupils switch from choosing to study non-EBacc subjects at GCSE towards studying EBacc subjects. The percentage of KS4 pupils taking EBacc qualifications has grown since 2010, which may explain this sharper change in curriculum time.
It may also reflect increases in the amount of curriculum time dedicated to each EBacc subject: i.e. increasing the number of weekly sessions timetabled to deliver a particular course. For example, the Department for Education’s Teacher Supply Model assumes that the new English and mathematics GCSEs require additional curriculum time to deliver.
A potential factor behind the shift in KS3 curriculum time towards EBacc subjects is that some schools have shifted from a traditional three-year KS3 to a shortened two-year version, enabling study for GCSE courses to run over three years. The demise of KS3 assessments after 2013 has given schools more flexibility in when pupils move from the KS3 curriculum onto GCSE study.
This may concern some in the school system if it is leading to the range of subjects pupils are studying narrowing earlier than it has done. Indeed, this issue has gained particular salience recently as Ofsted’s Chief Inspector, Amanda Spielman argued in her Festival of Education speech that “curtailing Key Stage 3 means prematurely cutting [a broad and rich curriculum] off for children who may never have an opportunity to study some of these subjects again”.
Which subjects have seen the biggest changes?
The data on average KS4 curriculum time per pupil shows considerable variation between subjects, beneath the overall EBacc trends. As we have previously shown, the different teacher recruitment and retention situations for different subjects may be driving part of this variation, as well as qualification and accountability policy changes.
Figure 2 shows that history and geography curriculum hours per pupil have risen considerably since 2010. Maths and English curriculum time have expanded as well, although the incentives to enter pupils for these qualifications, and for them to achieve C grades, were already strong before 2010. The introduction of new, more challenging, qualifications for maths and English have also contributed to more time being spent teaching them.
The same is not the case for science, where curriculum hours per pupil have stayed more or less stable since 2010. Languages teaching time has also been falling since 2013 after an initial increase between 2010 and 2012 that was similar to history and geography. This suggests that the lower-than-average recruitment and retention rates in science and languages may have constrained schools’ ability to offer more teaching in response to the growing incentive to do so.
Figure 2: All EBacc subjects except science increased Key Stage 4 teaching time per pupil since 2010
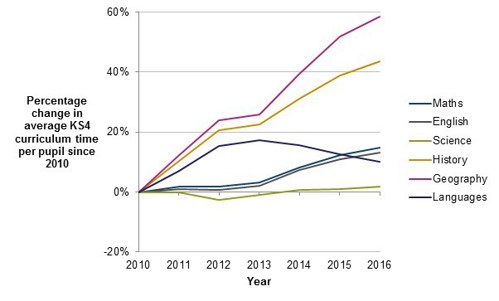
Source: School Workforce Census Statistical First Release and School and pupil numbers.
Since school spending per pupil has been relatively stable in real terms for the last seven years, allocating extra curriculum time and resources to teaching EBacc subjects may have often implied diverting them from non-EBacc subjects that offer less benefit in terms of school performance, as evaluated by the new headline measures.
Figure 3 shows that almost all non-EBacc subjects have seen significant reductions in teaching hours at KS4 during the 2010 to 2016 period. Only in religious education has the average curriculum time per pupil changed very little since 2010. PSHE, a subject that awards no GCSE qualifications, has had its average teaching time reduced to almost half the level it was in 2010. ICT and Design and Technology have also seen sharp drops in curriculum hours.
The curriculum time per pupil for arts subjects, which seems to have been relatively protected until 2013, has been declining ever since. Arts GCSE entries seem to be holding up, but it is unclear for how long given the recent downward trend in curriculum time.
Figure 3: Per pupil teaching time of Key Stage 4 non-EBacc subjects has reduced since 2010
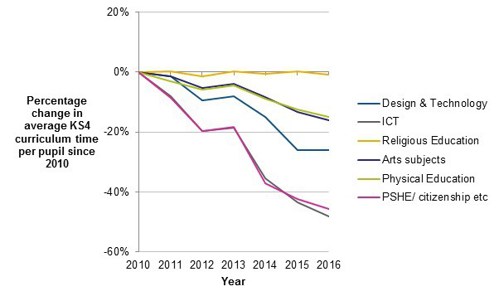
Source: School Workforce Census Statistical First Release and School and pupil numbers.
Accountability measures have had a considerable impact on the way curriculum time is allocated to different subjects in secondary schools, as well as on GCSE entries. The downward trend in time dedicated to non-EBacc subjects seems set to continue, despite the Government relaxing the timescale over which it intends to achieve the 90 per cent target. Squeezes on school budgets may also put additional pressure on the resources allocated to those subjects. As schools adapt and change their curriculum models over the next few years, this curriculum time data will be particularly important for monitoring national trends in what changes schools make to the KS3 curriculum.