What does the latest data tell us about the current financial situation in England’s local authority maintained schools?
Monday 19 February 2024
 Unprecedented increases in energy costs and rapid increases in the costs of food, alongside wider increases to the cost of living, have created significant pressures on schools and families across England since 2021. While our recent NFER cost of living research highlighted a number of key issues, we still know relatively little about how financial pressures are currently impacting schools.
Drawing on newly published Department for Education (DfE) data on the financial positions of local authority (LA) maintained schools in England in 2022/23[i], we investigate: how has the financial position of these schools changed in 2022/23? And, is it likely to improve or get worse in the near future?
How has LA maintained schools’ financial situations evolved during 2022/23?
School expenditure increased more rapidly on average than income during 2022/23
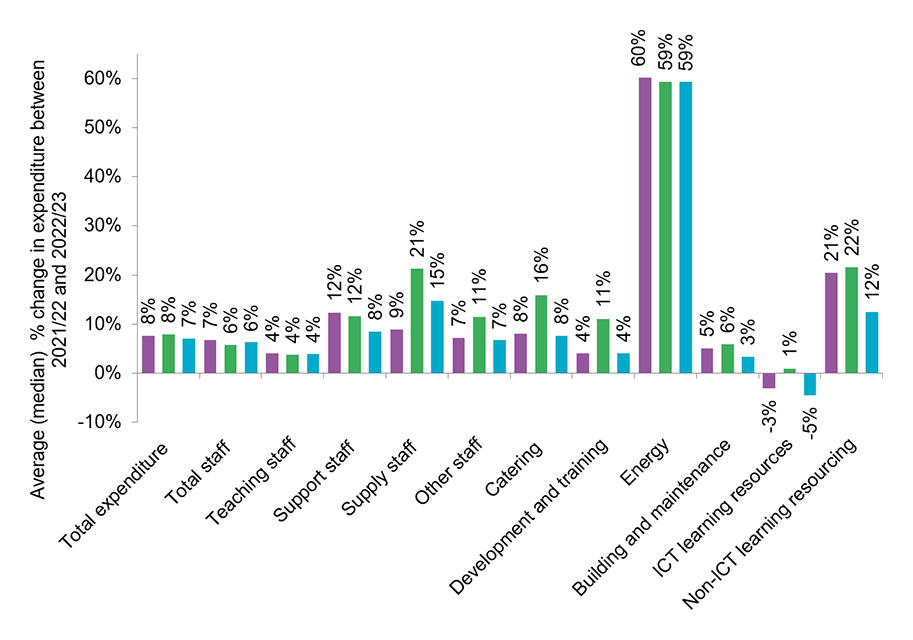
As illustrated in Figure 1, the average (median) percentage change in per pupil expenditure exceeded income between 2021/22 and 2022/23 for all school phases/types. As a result, three in every five LA maintained schools was running an in-year deficit in 2022/23, such that their expenditure exceeded their income. This ranged from 62 per cent of primary schools, 57 per cent of special schools and 47 per cent of secondary schools.
Figure 1 - Average (median) changes in income and expenditure per pupil, 2021/22 to 2022/23

Source: NFER analysis of DfE Consistent Financial Return (CfR) 2022/23. Note: Based on 9812 primary, 644 secondary and 566 special schools.
In-year deficit (surplus): A school whose annual expenditure is larger (smaller) than their annual income by the end of the financial year.
Overall deficit (surplus): A school with negative (positive) overall revenue balance. A school with an overall deficit will have depleted all their financial reserves.
The considerable cost pressures faced by schools in 2022/23 may partly explain this
Figure 2 presents the average (median) annual change across different types of school expenditures between 2021/22 and 2022/23 and – to enable comparison to pre-pandemic levels - between 2019/20 and 2022/23. It highlights that, on average, schools across all phases saw their per pupil energy costs increase by almost 60 per cent in 2022/23, although there was a wide-range of experience across schools with roughly one-in-four primary schools seeing their energy costs double in 2022/23.
Other notable cost pressures on schools in 2022/23 were support staff costs (such as teaching assistants (TAs) and supply teaching costs. But, as with energy costs, there was variability in the extent to which different schools have been affected. Among primary schools, a quarter saw their support staff costs increase by over 20 per cent, whereas a similar proportion experienced a less than five per cent increase.
Most schools reported making cuts in 2022/23 in response to financial pressures
While Figure 2 highlights that schools have seen their expenditures increase in 2022/23, these cost increases may not fully reflect the extent of financial pressures on schools. This is because some schools have cut their expenditure in response to budget pressures.
In our recent cost-of-living survey, four-fifths of schools reported reducing spending elsewhere in their budget in response to recent increases in the cost of living, with schools reporting making cuts in a wider range of areas. For example, almost half (47 per cent) of primary schools, 32 per cent of special schools and 28 per cent of secondary schools reported cutting TA numbers or hours. Further, almost two-fifths (37 per cent) of primary schools, almost three-tenths (28 per cent) of special schools and a fifth (20 per cent) of secondary schools had cut targeted learning support (e.g., tutoring).
Figure 2 Average (median) changes in expenditure per pupil
Change from 2021/22 and 2022/23
Average annual change from 2019/20 to 2022/23
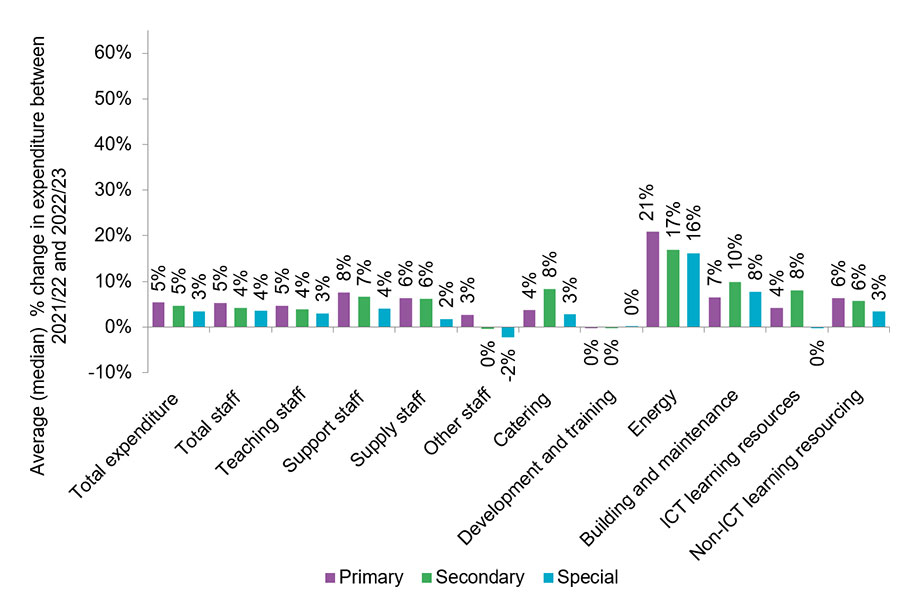
Source: NFER analysis of DfE Consistent Financial Return (CfR) 2022/23[ii]. Note: Based on up to 9812 primary, 644 secondary and 566 special schools.
The financial pressures experienced by schools in 2022/23 have increased the proportion of schools with an overall budget deficit
Indeed, over 10 per cent of LA maintained schools had a deficit on their revenue balance in 2022/23, as shown by Figure 3. This represents an increase on 2021/22, particularly for primary (increasing from 7.6 to 12.3 per cent) and special schools (increasing from 9.8 to 12.9 per cent). It also highlights that the improvements seen in schools’ financial positions which took place during pandemic has been reversed.
These figures are sizeable as any school running in this position must take steps towards returning to a neutral financial position. In most cases, this will mean that affected schools will need to make cuts in the coming year to balance their finances.
Figure 3 Percentage of LA maintained schools with an overall deficit in 2022/23
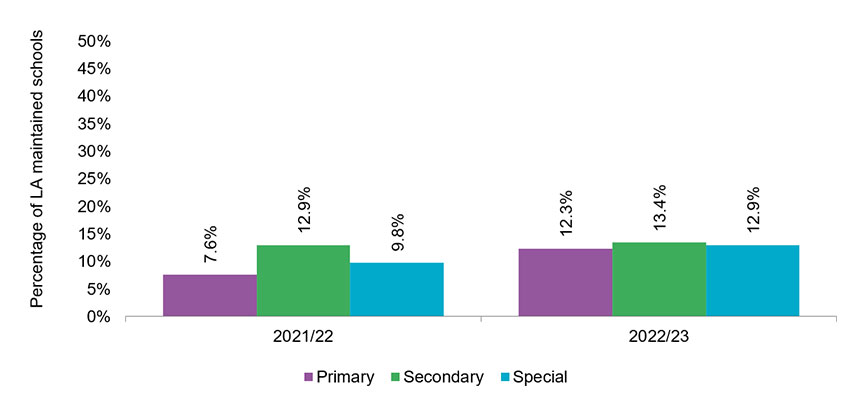
Source: DfE LA and School Funding Statistics. Note: Based on up to 10,035 primary, 727 secondary and 593 special schools.[iii]
More generally, financial pressures have led to a reduction in the levels of reserves across schools
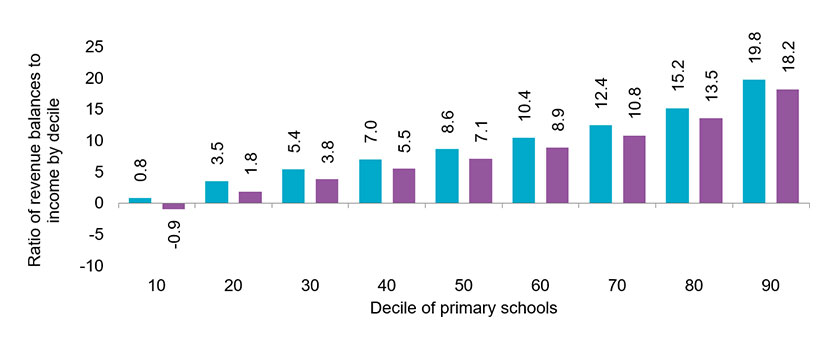
Figure 4 presents the ratio of reserves to annual income across the distribution of schools. It shows that, with some exceptions among secondary schools, the size of school reserves relative to annual income has fallen at all points in the distribution. This highlights that financial pressures have impacted a wide range of schools. If current spending patterns continue, among the schools who had positive revenue balances in 2022/23, we estimate that 13 per cent of special, 13 per of primary and seven per cent of secondary schools will have completely depleted their reserves by the end of this financial year.
Figure 4 Ratio of revenue balances to income by deciles and phase, 2021/22 and 2022/23
Primary
Secondary
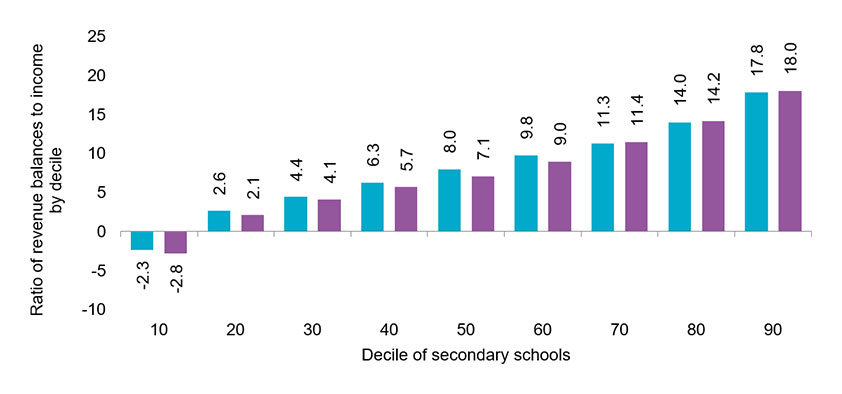
Special
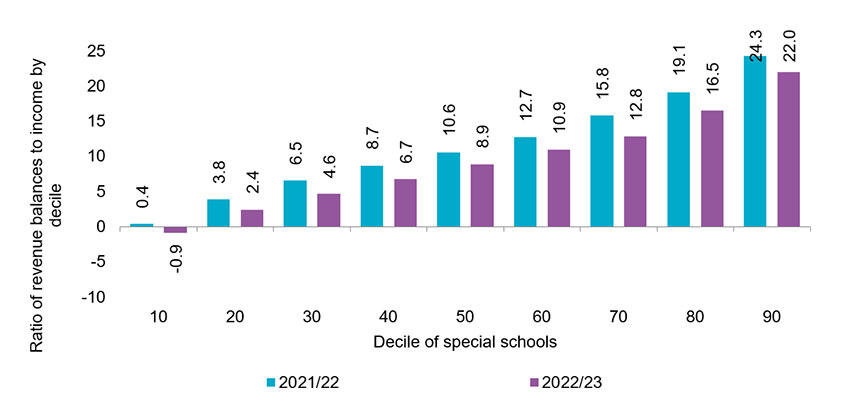
Source: NFER analysis of DfE Consistent Financial Return (CfR) 2022/23. Note: Based on up to 10,449 primary, 714 secondary and 597 special schools
While academies are not included in this analysis as their 2022/23 financial data is not yet published, it is important to note that emerging evidence suggests that the financial situation in academy trusts has also deteriorated in 2022/23. The recent Kreston Academies Benchmark Report for 2024 highlighted that among the trusts included in their sample, the share running in-year deficits had doubled from 19 per cent in 2021/22 to 47 per cent in 2022/23.
Looking to the future - There is limited scope for the financial positions for schools to improve in the coming years
Whilst the Government has increased the schools’ budget by a sizeable £3.5 billion in 2023/24 and this is set to increase by a further £1.5 billion in 2024/25[iv] , cost pressures on schools are also likely to remain high. The Institute for Fiscal Studies estimate that the Government’s planned increases in spending – once growth in school-specific costs is accounted for – will not be sufficient to return total school spending per pupil in 2023/24 and 2024/25 to 2021/22 levels. This highlights that while planned funding increases are welcome, they are unlikely to ease the current pressures on school budgets.
This is consistent with the findings from our cost-of-living survey which highlighted that just under half of mainstream schools and two-fifths of special schools were expecting both to have an in-year deficit and needing to make cuts to provision in 2023/24.
School buildings are also in need of significant investment
While the Reinforced Autoclaved Aerated Concrete (RAAC) crisis has only affected a (very unfortunate) minority of schools, it is only the thin end of the wedge. The National Audit Office estimate that around 700,000 pupils are learning in a school that the responsible body or DfE believes needs major rebuilding or refurbishment. With extensive repairs and improvements required across the school estate – which schools may be required to contribute towards, this is only likely to compound existing financial challenges.
Demographic change is likely to exacerbate the current financial challenges on schools, particularly in the primary sector
The birth rate has dropped in recent years and pupil numbers are expected to fall as a result, with primary pupils projected to decline by 11 per cent between 2023 and 2030. Each pupil in a school attracts funding for their setting, so fewer pupils will mean less income. But as small changes in pupil numbers do not typically affect a school’s fixed costs (as school staffing needs are typically unaffected by small changes in pupil numbers), this is likely to result in greater pressures on school budgets. Indeed, it is already the case that the regions where primary schools have seen the largest declines in pupil numbers in recent years – London, Yorkshire and the Humber and the North East - are also those where primary schools are most likely to be running an overall financial deficit.
Staff recruitment and retention challenges are also only likely to amplify financial pressures
Our cost-of-living research highlighted that recent cost pressures have only exacerbated the existing challenges faced by schools in recruiting and retaining teachers, TAs and support staff. The latest bleak teacher recruitment data suggests that teacher supply is likely to remain a critical challenge for the sector, unless action is taken. This is only likely to intensify pressures on school expenditures, such as further increasing supply staff costs for schools. Further, uncertainty about future teacher pay increases and the extent to which this will be covered by existing funding settlements only makes it more difficult for schools to navigate budgetary pressures, by introducing a large amount of unpredictability in planning budgets across years.
Without further action now, the financial situation in schools is likely to remain challenging for the foreseeable future
Our analysis highlights that, while there is wide variation, on the whole recent cost pressures have deteriorated the financial positions of schools, with a small group of schools facing a particularly precarious situation. There is a risk that where schools are having to make cuts to balance their budgets, these have persistent and long-term consequences on young people, wider society and longer-term economic prosperity.
As we approach the upcoming general election, it is critical that education spending remains a priority for all political parties, and that clear strategies are developed to support schools with addressing both current and evolving financial challenges, including proactively supporting schools to manage the impact of falling pupil numbers.
You can find NFER’s recent cost-of-living report series, funded by the Nuffield Foundation, and conducted in collaboration with ASK Research at this link.
References
[i] Academies are not included in this analysis, as their 2022/23 financial data will not be published until later this year. As of January 2024, academies make up 44 per cent of open primary schools (including all-through) and 82 per cent of open secondary schools.
[ii] Note NFER analysis is restricted to schools with a full year of financial returns and excludes schools with unrealistic financial data. School-level data is subject to further changes data by DfE and excludes schools in Birmingham due to data availability.
[iii] The sample used to construct national DfE data will differ from NFER analysis for the reasons outlined in (ii) above.
[iv] This is alongside additional funding for schools to cover the costs of increasing the average teacher pay offer to 6.5 per cent from September 2023.