The widening disadvantage divide: Disadvantaged primary schools appear to be most affected by falling pupil numbers
Wednesday 24 June 2026


Introduction
Recent data published by the Department for Education (DfE) reinforced what primary schools across England already know: pupil numbers are falling fast.
This is concerning because, a loss of pupils may not justify cutting a class or teacher but still causes a consequential drop in funding for a school. Our evidence (see previous NFER blogs here and here) has shown that this financial pressure leads to schools making adjustments, such as cuts to staffing and provision, which risk affecting the quality of education and pupils’ experiences of school.
This blog explores the emerging distributional consequences of falling pupil numbers in more detail. As well as reviewing the national and regional picture, we show that more disadvantaged schools are seeing pupil numbers fall faster than their counterparts.
This means the burden of adjusting to pupil numbers is sitting disproportionately with schools that are already likely to face significant challenges. We conclude by discussing the possible consequences and policy implications of this trend.
Across England, primary school pupil numbers could fall be five per cent by 2030
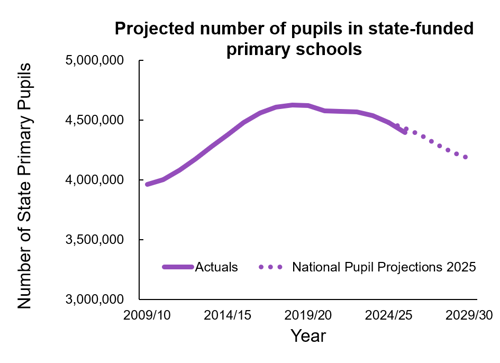
Since peaking in 2018/19, the number of pupils in state-funded primary schools has now fallen by almost five per cent. In 2025/26, we saw the largest fall in a single year so far. But falling numbers are set to snowball further, with DfE’s projections suggesting that the number of pupils in state-funded primary schools could fall by a further five per cent by 2030.
Secondary schools are vulnerable too. Secondary pupil numbers fell in the latest data for the first time since 2014 and DfE projections suggest these will see a significant decline from 2028 onwards.
The direction of these projections is largely driven by declining birth rates. ONS recently published new data showing that birth rates have continued to decline in the UK. A key second order factor influencing pupil numbers is international migration, while factors such as internal migration, housing availability and affordability, schools’ capacity and the availability of independent schools can have important effects at the local level.
All regions in England are seeing primary-school pupil numbers falling
While pupil numbers have fallen by almost five per cent nationally, the impact on individual schools has been uneven. Many schools have faced larger falls in recent years, and many will do so over the next five to ten years, especially in London. On the flip side, other schools will see smaller falls or no fall at all.
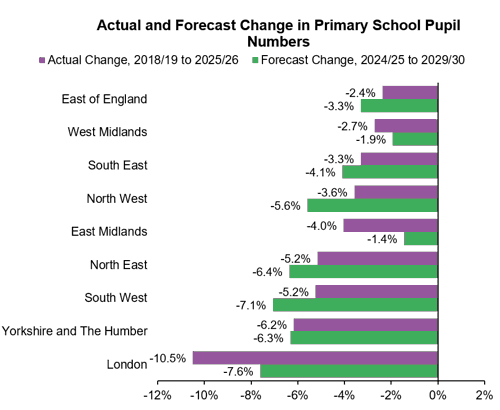
Indeed, falling pupil numbers are not affecting all regions equally, as we can see in the chart below. (This uses local authorities’ projections of future numbers in their area, such that data is not directly comparable to the national projections.)
We can see:
- Schools in London have been most affected by falling pupil numbers and this trend is set to continue.
- Other regions have also been particularly affected, which is projected to continue in the coming years. Yorkshire and the Humber, the South West, the North East and the North West are all set to see relatively large falls by 2030.
- While data shows that all regions have seen a fall in numbers since 2019, the East of England and the West Midlands have been less affected than others.
- Looking forward, the projected fall in numbers in the East Midlands is the smallest of any region.
The regional data suggests a varied experience of falling pupil numbers across the country.
This impression is reinforced when we look within regions. 17 local authorities (out of 153) project an increase in the number of primary school children in their area between 2024/25 and 2029/30. Luton is projecting an increase of eight per cent in that time, the largest in the country. Even some local authorities in London – Havering, along with Barking and Dagenham – say their numbers are set to increase.
As such, it is important to remember that primary pupil numbers are not falling everywhere and impacts will be disproportionately felt in some areas.
Pupil numbers have fallen the most in the most disadvantaged schools
In their recent report on falling pupil numbers, the National Audit Office (NAO) highlighted that “Falling pupil numbers could disproportionately affect disadvantaged children as lower performing schools tend to have a higher proportion of both disadvantaged children and unfilled spaces.” The NAO noted that DfE had not investigated this risk.
We build on this finding by looking at whether schools with higher rates of disadvantage (as measured by the free school meals rate, or FSM rate) have seen the largest fall in pupil numbers in recent years. If true, it suggests the challenge the NAO uncovered could get significantly worse as pupil numbers fall further over the next five years.
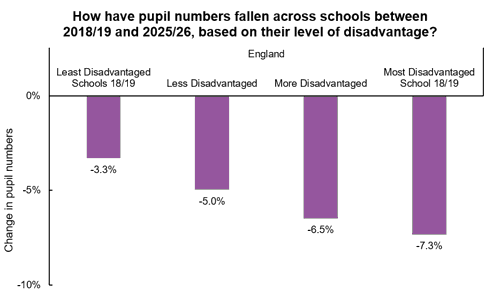
The chart below shows that - across all schools in England - there is a clear correlation between schools’ FSM rates and the change in pupil numbers. Schools with the highest FSM rates (as measured in 2018/19) have tended to experience the largest fall in pupil numbers since then, at 7.3 per cent. Conversely, schools with the lowest FSM rates have tended to experience the smallest falls, at 3.3 per cent.
As the average fall in pupil numbers across the whole of England is relatively modest, we also looked at areas of the country that have experienced larger falls to see whether our findings change. To some extent, this gives us a preview of what could happen more widely across England as numbers fall further.
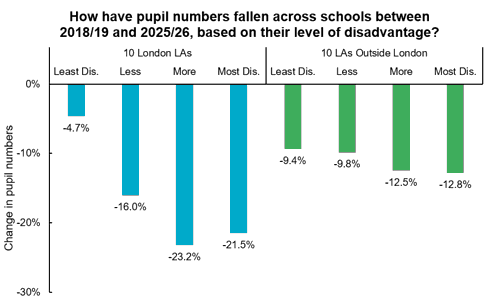
We looked at the ten London local authority (LA) areas that have experienced the largest fall in pupil numbers since 2018/19. Across these areas the most disadvantaged schools have seen a 21.5 per cent drop in pupil numbers. This is more than four times larger than the group of schools with the lowest FSM rates, at 4.7 per cent.
Additional analysis suggests this trend is primarily explained by a fall in the average number of pupils per school, rather than a fall in the number of schools.
We also looked at ten LAs outside of London that have seen their pupil numbers fall the most since 2018/19. While the same general pattern holds, the differences between the four groups are not as large as they are in the London LAs. This may be because parents have more viable local options in London compared to other parts of the country, so may be more likely to choose to move their child when a place become available elsewhere.
The conclusion is nonetheless clear. On average, schools with higher rates of disadvantage have seen significantly larger falls in their pupil numbers over the last seven years than schools with lower FSM rates.
The schools that have seen the largest fall in pupil numbers have the highest rates of disadvantage today
To test the data further, we also looked at how FSM rates differ across schools, depending on how schools’ pupil numbers have changed in the last seven years. It is important to bear in mind here that FSM rates have dramatically increased across England in recent years, due to transitional arrangements for Universal Credit.
In England, schools that have experienced the largest fall in pupil numbers since 2018/19 have an FSM rate of 30 per cent on average in 2025/26. Schools that have experienced the smallest falls in pupil numbers have an FSM rate of 23 per cent on average.
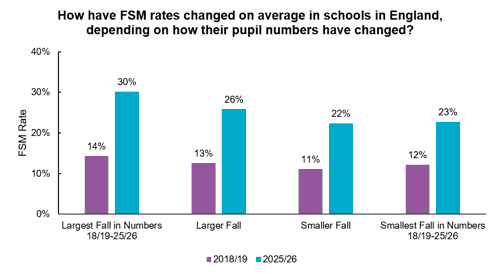
We can also see that schools with the largest fall in pupil numbers already had higher FSM rates in 2018/19, at last on average. However, FSM rates have increased more rapidly for those schools since then. For example, the schools with the largest fall in pupil numbers have seen a 16 percentage point increase in their FSM rate. The schools with the smallest falls have seen their FSM rates increase too, but only by 10 percentage points (when rounded).
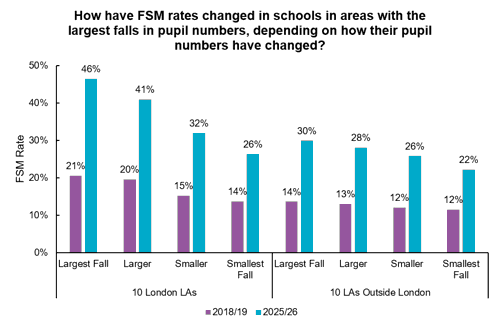
As above, we can also look at LAs where pupil numbers have fallen the most since 2018/19. When we do, we see a stronger version of the national trend. For example, in those ten London LAs, the schools that have seen the largest fall in pupil numbers have an FSM rate of 46 per cent, up by 26 percentage points since 2018/19. Schools that have seen the smallest falls have an FSM rate of 26 per cent, up by 13 points since 2018/19.
Across these areas, the schools that have been most affected by falls in pupil numbers are the most disadvantaged and have seen their rates of disadvantage grow faster than all others. This is a striking trend, but we do need to exercise some caution. Other factors – such as the interaction between underlying levels of disadvantage and the Universal Credit transitional arrangements – may also explain the patterns observed.
Conclusions
In this blog, we have built on previous NAO evidence that the impact of falling rolls may be disproportionately affecting disadvantaged children and their outcomes. We have shown there is a clear link between disadvantage (as measured by FSM rates) and falling pupil numbers in England’s primary schools:
- The schools with the highest FSM rates in 2018/19 have experienced the largest fall in pupil numbers since then.
- The schools with the largest fall in pupil numbers have the highest FSM rates today, and have seen the largest increase in FSM rates since 2018/19 too.
This evidence has important implications for public policy. Falling pupil numbers adversely affect a school’s funding, thereby hindering a schools’ ability to improve outcomes for students. The evidence presented here shows that there is a growing divide between schools experiencing the most significant falls in pupil numbers and those that are not.
This will increasingly hamper the education of disadvantaged pupils and undermine progress towards the government’s long-term objective of halving the disadvantage gap in Key Stage 4 attainment.
To mitigate these risks, NFER recommends that:
- DfE should urgently assess the impact of falling pupil numbers on disadvantaged pupils’ outcomes.
- DfE should increase the level of support they give to schools (via LAs) through the falling rolls fund. The current criteria - that numbers fall in the local area by ten per cent in one year – mean this funding is limited. Easing this threshold and increasing support would help reduce the need for immediate cuts to school spending, which risk harm to pupils’ outcomes.
- Local authorities need to make proactive decisions about the distribution of schools in the local area, in partnership with parents, schools and trusts. Only by doing this can they ensure all children have access to an excellent and sustainable local school, irrespective of their background.
- Local authorities and system leaders should be working closely with schools to monitor how pupil numbers are changing in schools’ neighbourhoods and help them plan accordingly, even in areas that have not seen significant falls yet.
Thank you for reading this blog. In early July, we will release a second blog looking at how schools are being affected by falling pupil numbers and rising Special Educational Needs (SEN) rates at the same time.
Footnotes
Notes on the analysis of the relationship between falling pupil numbers and schools’ FSM rates:
- All counts of pupils use full time equivalent values.
- Schools that opened between 2018/19 and 2025/26 could not be included in the analysis because they did not have an FSM rate in 2018/19. While schools that became academies during this period are included, schools that split up or merged with other schools during this period were excluded. Schools that closed during this period are included in the first part of the analysis but not the second.
- The LAs in London with the largest fall in primary pupil numbers between 2018/19 and 2025/26 were: Westminster, Lambeth, Southwark, Hackney, Islington, Camden, Merton, Hammersmith and Fulham, Enfield and Wandsworth. The LAs outside London with the largest falls in this time were Torbay, Calderdale, Brighton and Hove, Redcar and Cleveland, Rutland, York, North Lincolnshire, Isle of Wight, East Sussex and Southampton. LAs that have experienced boundary changes during this period could not be included in this group and these were: Bournemouth, Christchurch and Poole, Cumberland, Dorset, North Northamptonshire, Westmorland and Furness, and West Northamptonshire. The City of London was also omitted because it is much smaller than any other LA.
- The main results here are not driven by geographical correlations between high FSM rates and falling pupil numbers. This is because we assigned schools to quartiles based on how their FSM rate compare to other schools in their LA, rather than across England. This means it is schools with higher levels of disadvantage relative to schools in the same LA that are shown to have the largest falls in pupil numbers. We do the same with falls in pupil numbers in the second part of the analysis.