
Exploring the relationship between falling pupil numbers and SEND rates in primary schools
Wednesday 8 July 2026


 Introduction
Recently published Department for Education (DfE) data has highlighted that the number of pupils with Special Educational Needs and Disabilities (SEND) in primary schools is continuing to grow rapidly. This is alongside an accelerating decline in pupil numbers in primary schools, primarily driven by falling birth rates.
This means many primary schools will be grappling with the twin pressures of responding to falling rolls and increasing proportions of pupils with SEND.
Recent NFER research highlighted that “While, in principle, funding arrangements are intended to reflect need, the requirement for schools to meet the first £6,000 of additional provision for each pupil with an Education Health and Care Plan (EHCP) means that schools with higher concentrations of pupils with SEND face a disproportionate call on their core budgets.”
In the research, these schools reported heavier workloads and greater resource pressures than other schools, as well as acute financial strain. These pressures are likely to be exacerbated in schools where pupil numbers are falling rapidly.
This raises an important question: to what extent are the primary schools experiencing the biggest declines in pupil numbers also those with the highest proportion of pupils with SEND?
This blog investigates that question by exploring the interaction between the rates of SEND in primary schools and falling numbers. It builds on our recent blog which identified a strong relationship between falling pupil numbers and the most disadvantaged schools.
|
A methodological note on SEND data
There are two levels of support currently used to identify and target support to pupils with SEND in schools. Education, Health and Care Plans (EHCPs) are support plans put in place by the Local Authority (LA) for pupils requiring a higher level of support. EHCPs are legally binding documents outlining a pupil’s needs and the support that must be provided.
SEN Support generally describes a lower level of support that can be provided by teachers or teaching assistants. This is largely funded through a school’s existing budget, albeit some local authorities (LAs) provide additional funding for pupils on SEN Support.
Our blog presents analysis for both pupils with EHCPs and pupils with any identified SEND (EHCPs or SEN support).
Both of these measures may be influenced by local thresholds and school identification practices. As such, differences between schools may partly reflect variation in recording behaviour rather than underlying need. It is important to bear this in mind when interpreting the findings below. |
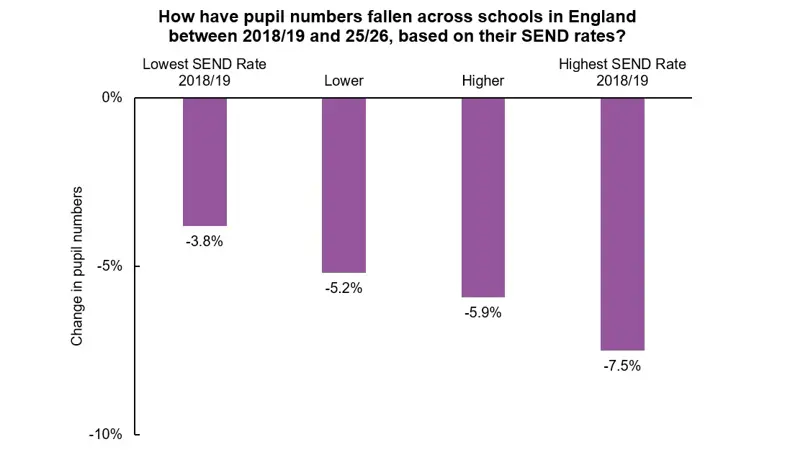
There is some evidence that primary schools with a higher percentage of pupils who have any SEND are seeing larger falls in their pupil numbers.
In this analysis, we look at how schools’ pupil numbers have change since 2018/19, when they peaked. We split schools into four groups based on their SEND rates in 2018/19.
In short, schools with higher SEND rates have tended to see larger falls in pupil numbers. As shown by the chart below, schools with the highest SEND rates in 2018/19 have seen their pupil numbers fall by around 7.5 per cent since then, whereas those with the lowest SEND rates have seen falls of 3.8 per cent.
We also looked at the LAs in England where pupil numbers have fallen the most since 2018/19. This gives us a sense of how schools may behave as pupil numbers fall. In the 10 London LAs where numbers have fallen the most since 2018/19, we see that schools with higher SEND rates have tended to see larger falls in pupil numbers on average (see data appendix).
However, this is not true for the 10 LAs most affected by falling rolls outside London. This may reflect differences in how pupils are placed in schools across the country. For example, parents in London areas may consider sending their children to a wider set of schools than those in less urban areas.
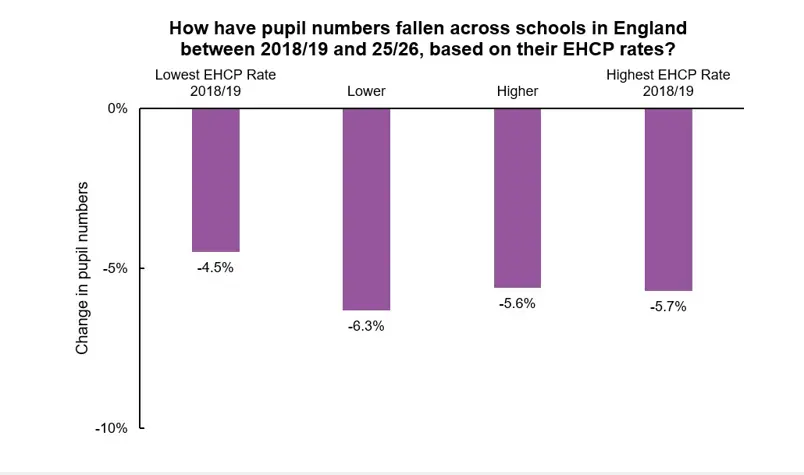
We did not find a relationship between higher EHCP rates in 2018/19 and how pupil numbers have fallen since then.
We also looked at the relationship between EHCP rates and subsequent falls in pupil numbers. As shown in the chart below, we did not find a clear relationship.
One possible explanation for the difference in patterns between EHCP and any SEND rates is that pupils with EHCPs have priority in school admissions. This means they may be more likely to attend the school of choice in an area, which may be less likely to be impacted by falling rolls. This is not the case for pupils with SEN support.
Schools that have seen larger falls in pupil numbers have higher rates of SEND, although differences are not large.
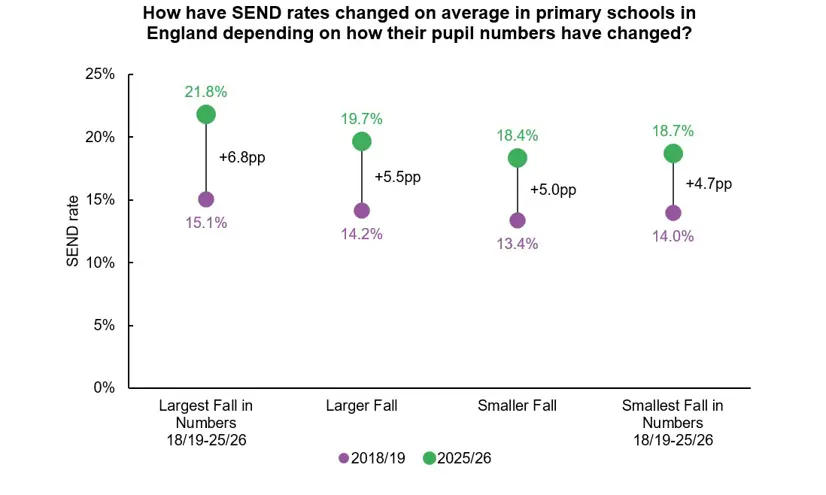
We also looked at whether schools that have seen the largest fall in pupil numbers have higher SEND rates than other schools. As SEND rates have increased during this period for most schools, irrespective of falling numbers, we have also compared changes in SEND rates.
We find there is a moderate relationship between falling pupil numbers and SEND rates. As seen in the chart below, primary schools with the largest falls in pupil numbers since 2018/19 have the highest SEND rates today, at 21.8 per cent on average.
These schools have also seen the largest rise in SEND rates since 2018/19, at 6.8 percentage points. Overall, there is a trend between falling pupil numbers and both SEND rates in 2025/26 and changes in SEND rates, but both trends are modest.
We also looked at whether the same is true for ECHP rates, as in the chart below. Again, we can see evidence of a modest trend. Schools with the largest falls in pupil numbers have both the highest EHCP rates in 2025/26 and the largest increase in EHCP rates between 2018/19 and 2025/26, but the differences between this group and others are quite small.
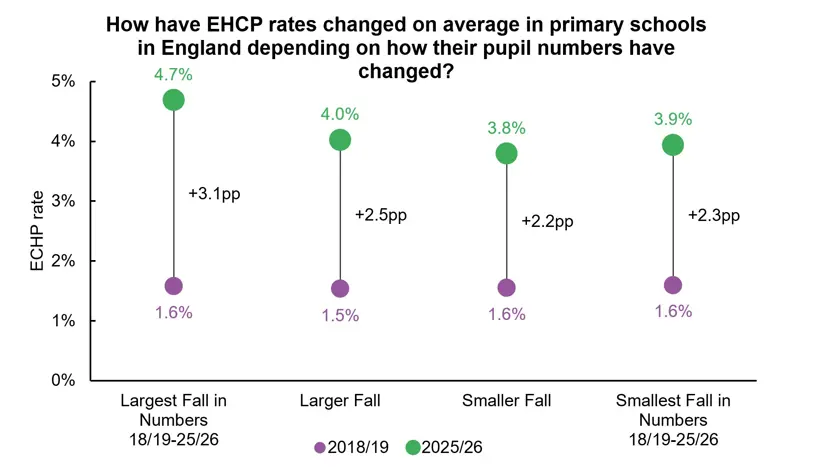
Finally, we looked at the 10 LAs in- and outside London with the largest falls in pupil numbers (see data appendix). We find a similar pattern to the national data, for both SEND and EHCP rates, which reinforces the conclusion there is a weak relationship.
The relationship between falling rolls and rising SEND is relatively weak, but the risks for affected schools are clear
To recap:
· Across England, primary schools with the highest SEND rates in 2018/19 have seen the largest fall in pupil numbers between then and 2025/26. However, this trend was not very strong. When looking at school EHCP rates only, there was no clear relationship with falling numbers.
· The schools that have seen the largest falls in pupil number since 2018/19 have tended to see the largest increases in any SEND and EHCP rates since 2018/19. Again though, this trend is relatively weak and most schools have seen rises in SEND and EHCP rates, irrespective of changes in pupil numbers.
A possible explanation for these trends - where they do exist - is that schools with falling numbers have more capacity to take on pupils – be they SEND or not.
If they get more SEND pupils, they may establish a local reputation for supporting pupils with these needs, leading to further applications for SEND pupils to join that school.
This is reflected in the findings from our recent high SEND schools report, which highlighted that the concentration of pupils with SEND appears to be driven by a structural steering effect: pupils are pulled towards certain schools with reputations and expertise in inclusion and pushed towards them when capacity in other schools is constrained.
The key risk is that, in schools where these pressures do coincide, falling rolls may reduce budgets and staffing capacity at the same time as rising SEND needs are increasing costs, making it harder to sustain effective support for pupils with SEND.
This risk is heightened by previous NFER evidence showing that schools in London areas with the largest falls in pupil numbers have seen substantial reductions in teaching assistants, many of whom play a key role in supporting pupils with SEND.
To address this risk, NFER recommends that:
· As part of its implementation of the SEND white paper, DfE needs to closely monitor the interaction between falling pupil numbers, rising SEND need and its reforms. In particular, the department should monitor how schools are responding to falling rolls and ensure this response is not undermining the system and posing a risk to SEND pupils. This is especially vital at a time when changes are being introduced.
· System leaders should monitor how pupils with SEND are distributed across schools and take action to support a more even spread of need. This should be coupled with adequate funding and support to ensure budget pressures from falling rolls do not exacerbate challenges to supporting pupils with SEND.
Data appendix: Tables on the LAs in- and outside London with the largest falls in pupil numbers
|
Table 1: Changes in pupil numbers across state-funded primary schools, by SEND or EHCP rates in 2018/19 |
||
|
Area |
Rate in 2018/19 |
Change in Pupil Numbers |
|
10 London LAs with largest falls in numbers 2018/19 to 2025/26 |
Lowest SEND Rate |
-7.8pp |
|
Lower |
-15.0pp |
|
|
Higher |
-19.8pp |
|
|
Highest SEND Rate |
-22.9pp |
|
|
Lowest EHCP Rate |
-11.pp |
|
|
Lower |
-17.5pp |
|
|
Higher |
-16.0pp |
|
|
Highest EHCP Rate |
-19.7pp |
|
|
10 LAs outside London with largest falls in numbers 2018/19 to 2025/26 |
Lowest SEND Rate |
-10.1pp |
|
Lower |
-12.3pp |
|
|
Higher |
-9.7pp |
|
|
Highest SEND Rate |
-12.7pp |
|
|
Lowest EHCP Rate |
-11.6pp |
|
|
Lower |
-10.2pp |
|
|
Higher |
-12.7pp |
|
|
Highest EHCP Rate |
-9.8pp |
|
|
Table 2: SEND and EHCP rates in state-funded primary schools in 2025/26, by changes in pupil numbers between 2018/19 and 2025/16 |
|||||||
|
Area |
Change in Pupil Numbers |
SEND Rate |
EHCP Rate |
||||
|
18/19 |
25/26 |
Change |
18/19 |
25/26 |
Change |
||
|
10 London LAs with largest falls in numbers 2018/19 to 2025/26 |
Largest Fall |
17.0% |
25.4% |
+8.5pp |
2.7% |
7.3% |
+7.3pp |
|
Larger |
17.4% |
23.2% |
+5.8pp |
2.9% |
6.1% |
+6.1pp |
|
|
Smaller |
14.0% |
19.9% |
+5.9pp |
2.5% |
4.9% |
+4.9pp |
|
|
Smallest Fall |
13.2% |
18.7% |
+5.5pp |
2.2% |
4.1% |
+4.1pp |
|
|
10 LAs outside London with largest falls in numbers 2018/19 to 2025/26 |
Largest Fall |
14.7% |
22.5% |
+7.9pp |
1.7% |
4.2% |
+4.2pp |
|
Larger |
14.9% |
20.0% |
+5.2pp |
1.6% |
3.5% |
+3.5pp |
|
|
Smaller |
14.6% |
19.8% |
+5.2pp |
1.7% |
3.9% |
+3.9pp |
|
|
Smallest Fall |
13.4% |
18.9% |
+5.4pp |
1.8% |
3.8% |
+3.8pp |
|
Notes on the analysis of the relationship between falling pupil numbers and schools’ SEND and ECHP rates:
- All counts of pupil numbers use full-time equivalent values. SEND and EHCP rates are measured using headcounts.
- Schools that opened between 2018/19 and 2025/26 could not be included in the analysis because they did not have a SEND or EHCP rate in 2018/19. While schools that became academies during this period are included, schools that split up or merged with other schools during this period were excluded. Schools that closed during this period are included in the first part of the analysis but not the second.
- The LAs in London with the largest fall in primary pupil numbers between 2018/19 and 2025/26 were: Westminster, Lambeth, Southwark, Hackney, Islington, Camden, Merton, Hammersmith and Fulham, Enfield and Wandsworth. The LAs outside London with the largest falls in this time were Torbay, Calderdale, Brighton and Hove, Redcar and Cleveland, Rutland, York, North Lincolnshire, Isle of Wight, East Sussex and Southampton. LAs that have experienced boundary changes during this period could not be included in this group and these were: Bournemouth, Christchurch and Poole, Cumberland, Dorset, North Northamptonshire, Westmorland and Furness, and West Northamptonshire. The City of London was also omitted because it is much smaller than any other LA.
- In order to show the main results here are not driven by geographical correlations between high SEND or EHCP rates and falling pupil numbers, we assigned schools to four groups four groups based on how their SEND and EHCP rates compare to other schools in their LA, rather than across England. This means it is schools with higher levels of SEND relative to schools in the same LA that are shown to have the largest falls in pupil numbers. We do the same with falls in pupil numbers in the second part of the analysis.